Heart Disease Prediction Using Machine Learning (With GUI)
Dataset Features:
- age
- sex
- chest pain type (4 values)
— Value 0: typical angina
— Value 1: atypical angina
— Value 2: non-anginal pain
— Value 3: asymptomatic
- trestbps: resting blood pressure (in mm Hg on admission to the hospital)
- chol: serum cholestoral in mg/dl
- fbs: (fasting blood sugar > 120 mg/dl) (1 = true; 0 = false)
- restecg: resting electrocardiographic results
— Value 0: normal
— Value 1: having ST-T wave abnormality (T wave inversions and/or ST elevation or depression of > 0.05 mV)
— Value 2: showing probable or definite left ventricular hypertrophy by Estes’ criteria
- thalach: maximum heart rate achieved
- exang: exercise induced angina (1 = yes; 0 = no)
- oldpeak = ST depression induced by exercise relative to rest
- slope: the slope of the peak exercise ST segment
— Value 1: up-sloping
— Value 2: flat
— Value 3: down-sloping
- ca: number of major vessels (0–3) colored by fluoroscope
- thal: 3 = normal; 6 = fixed defect; 7 = reversible defect
- target : 0=low risk of heart attack, 1=high risk of heart attack
As you can see from the output above, This dataset contains 13 features and 1 target variable.
I have mentioned some questions to discuss this project, so let’s solve them one by one. So let’s get started.
1. Importing the Libraries
Here, I have imported only one library, Pandas. We will import other libraries as per our requirements.

2. Importing the Dataset

3. Taking Care of Missing Values
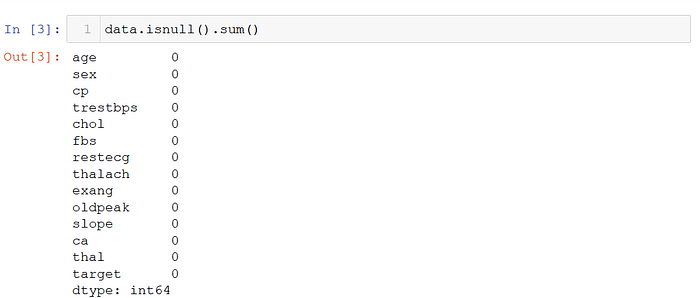
Looking at the output, we can see that we are fortunate this time. There is no missing value in our dataset.
4. Taking Care of Duplicate Values
Let’s first check whether our dataset contains some duplicated values. We are interested in the boolean answer yes or no (Means True or False).

As you can see here, the output is True, which means our dataset has some duplicate values. So let’s drop them.

Now let’s check for the duplicated values once again.

As you can see here, the output is False, which means our dataset becomes free from duplicated values.
5. Data Processing
In this question, we have to perform preprocessing. Before that, let’s separate categorical columns and numerical columns (Means columns with categorical values and columns with numerical values). because we have to handle them separately.
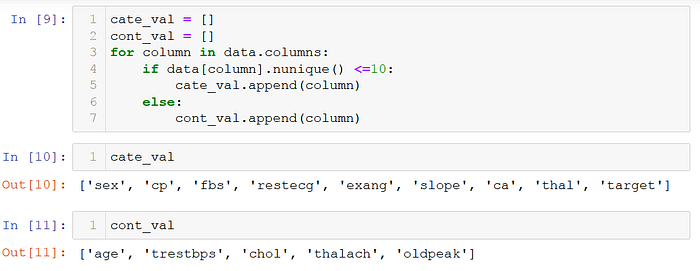
6. Encoding Categorical Data
To explain the concept of encoding, let me take one column from the list of categorical columns CP (Chest Pain Type) Having four values 0,1,2 and 3. Because of these values in the CP column, some of the machine learning models can understand there are numerical orders between these values. So these models can understand order does matter. But this is not the case. There is no order here. It is just a chest pain type.

So we will convert these CP column values into binary vectors, which means the CP column will be converted into four columns (Also other categorical columns). Why four? Because it has four unique values, if five unique values the five likewise.
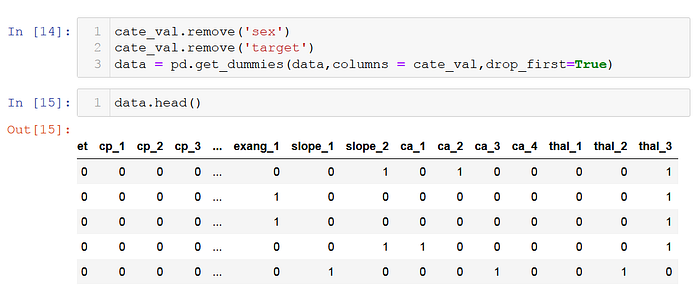
From the above output, we can see the binary vectors. These variables are called dummy variables. To create these dummy variables, I have used the get_dummies method of Pandas. I have removed sex and target columns from the list because they are already in the proper format.
From the above output, we can see the binary vectors. These variables are called dummy variables. To create these dummy variables, I have used the get_dummies method of Pandas.
I have removed sex and target columns from the list because they are already in the proper format. These dummy variables can create one problem called a dummy variable trap. What is a dummy variable trap? The dummy variable is a scenario in which the independent variables are highly correlated. In simple terms, one variable can be predicted from others. To remove this problem of dummy variable trap, we have used drop_first = True.
7. Feature Scaling
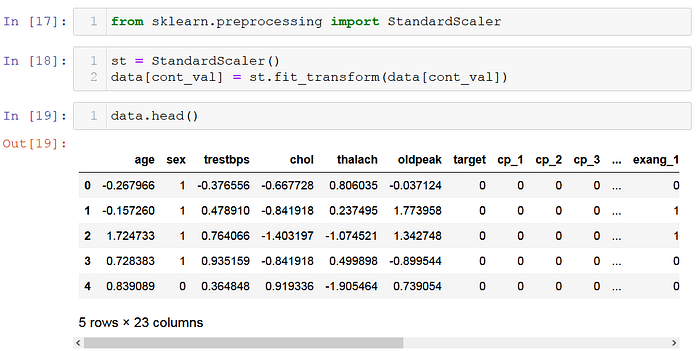
Feature scaling allows us to put our features into the same scale. Why do you need to do this?
Please remember, feature scaling is essential for machine learning algorithms that calculate distances between data. If not scale, the features with a higher value range start dominating when calculating distances.The machine learning algorithms requiring feature scaling are mostly KNN, Neural Networks, SVM, Linear Regression, and Logistic Regression. The machine learning algorithms that do not require feature scaling are mostly non-linear machine learning algorithms like Decision Tree, Random Forest, Adaboost, Naive Bayes, etc. Please remember, any non-distance-based algorithm is not affected by feature scaling.
8. Splitting The Dataset Into The Training Set And Test Set
We will split our dataset into two sets: one set for training and one for testing. I split the dataset into 80% training data and 20% testing data.
Train the model on the training set.
Test the model on the testing set, and evaluate how well we did.

9. Logistic Regression
Logistic regression is one of the most popular Machine Learning algorithms under the Supervised Learning technique. It is used for predicting the categorical dependent variable using a given set of independent variables.
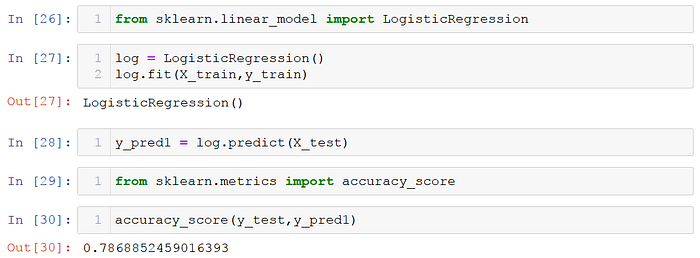
From the above score, we can see that Logistics Regression is 79% accurate on this dataset.
10. SVC (Support Vector Classifier)
Support vector machines (SVMs) are powerful yet flexible supervised machine learning methods used for classification, regression, and detection of outliers. We are going to use it for the classification program.
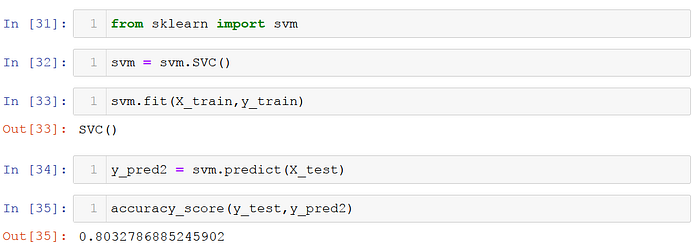
From the above score, we can see that SVC is 80% accurate on this dataset.
11. K Neighbors Classifier
The K Nearest Neighbor algorithm falls under the Supervised Learning category and can be used for classification and regression. It is also a versatile algorithm for imputing missing values and resampling datasets.
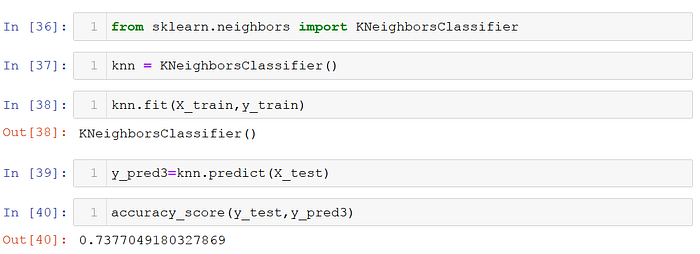
From the above score, we can see that K Neighbours Classifier is 74% Accurate on this dataset.
By default, this K Nearest Neighbor algorithm uses five neighbors. So we will find the best value for the number of neighbors.

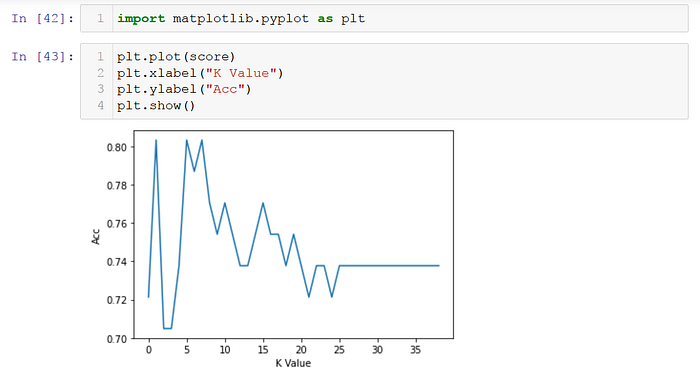
As we can see from the above plot, the best value for the n_neighbors parameter is 2. So let’s use this value.

As you can see, the accuracy has increased to 81%. Previously it was 74%.
Non-Linear ML Algorithms
As discussed, encoding and feature scaling are not required for non-linear ML Algorithms.So let’s load our dataset once again, and also, we are going to remove duplicate values.

12. Decision Tree Classifier
A Decision Tree is a supervised learning technique that can be used for both classification and Regression problems, but mostly it is preferred for solving Classification problems.
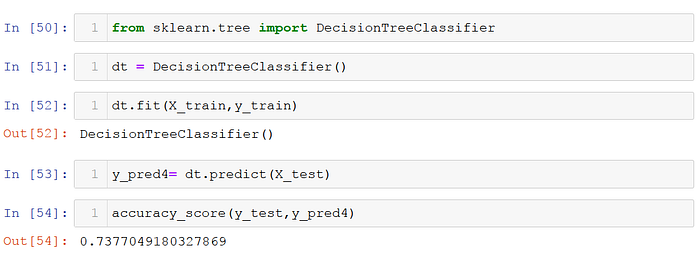
13. Random Forest Classifier
A random forest is a meta estimator that fits several decision tree classifiers on various sub-samples of the dataset and uses averaging to improve the accuracy and control over-fitting. So let’s use a random forest classifier for our dataset.
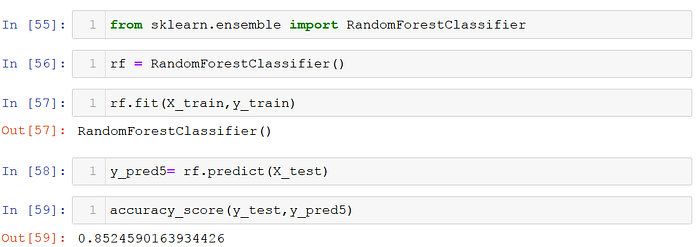
From the above score, we can see that Random Forest Classifier is 85% Accurate on this dataset.
14. Gradient Boosting Classifier
For more information regarding Gradient Boosting Algorithm, you can visit this link: https://en.wikipedia.org/wiki/Gradient_boosting
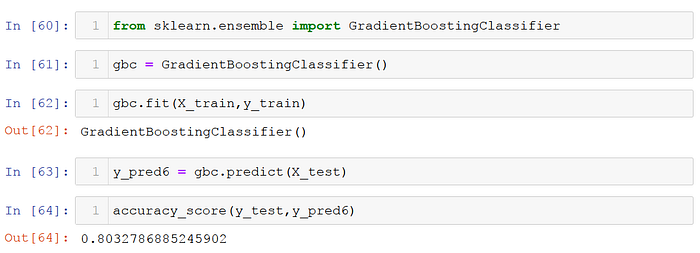
From the above score, we can see that Gradient Boosting Classifier is 80% Accurate on this dataset.
Let’s draw a barplot to compare models’ accuracy.As you can see below, I have created a pandas data frame.
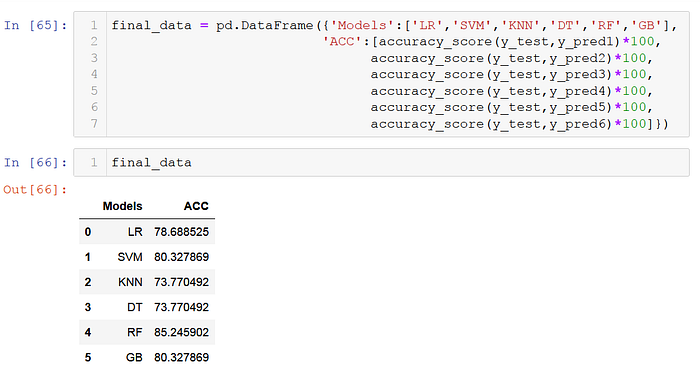
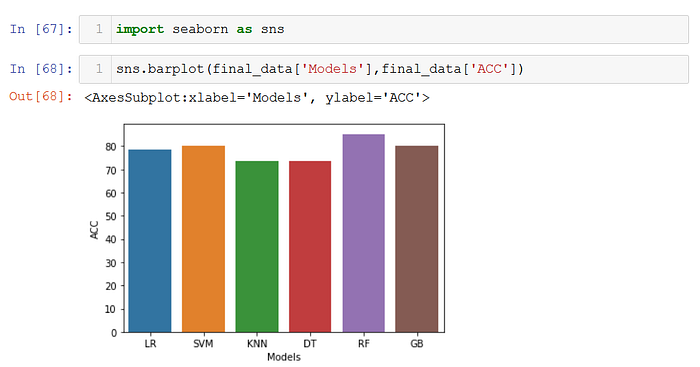
As we can see from the above plot, a Random forest classifier is the best algorithm for this dataset.
So please remember, we have trained our model on X_train and y_train (means on 80% data only). Before model deployment, we have to train our selected mode on 100% data. So let’s train our random forest model on 100% data.

15. Prediction on New Data
Let’s perform prediction on new data using a random forest algorithm. For that, I have created a pandas dataframe.
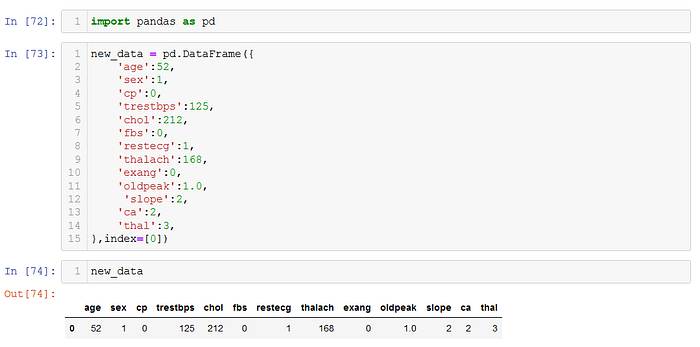

Now, let’s save our trained model, so again and again, training is not required. We can perform predictions using the saved model.

GUI
Here we are going to create GUI for our project. So anyone can perform predictions using this GUI.
For complete source code in GUI format:
https://www.instagram.com/pct_parvatcomputertechnology/

Comments
Post a Comment